
Let not thy left hand know
A lack of coordination means an interesting risk premium for Australian Bonds

TLDR:
The RBA bought a lot of bonds, then the government sold even more
The RBNZ bought most of the bonds the government issued as they came
This lack of coordination has meant a new price regime for AU vs NZ rates
Australia and New Zealand are one of the more frequently traded country pairs in bond markets, and for the last couple of years I’ve been covering them for institutional investors. Strong institutional similarities (they share the same banks) and economic linkages mean there’s plenty of reasons for convergence, and events always provide plenty of reasons for divergence. One such reason has just kicked in, and whilst I’ve seen it before, this time threw it into particularly sharp relief and now I’ve got a name for it: Uncoordinated policy premium. This blog is not for trade recommendations, so all I’ll do is point out that the premium exists, and that as I sit down to write this post, it’s disappearing fast.
The coordination that’s relevant here is that between central banks and debt management offices. In mid march, both Australia and New Zealand announced both large extra government spending programs and government bond purchases by their respective central banks. The RBA did not mess around. On the 16th of March, they announced their readiness to buy government bonds. Their issued reserves increased by a factor of 3.5 from 40bio to just under 140bio as of today (22may). Having operated under a required reserves regime , they changed the rules of monetary policy with (to me) astonishing speed - and purchased around 10% of the outstanding stock of ACGB’s in about 2 weeks (circa 50bio out of 500bio) . By March 31st, the treasury had announced their spending plans and the RBA stopped buying, here their total deposit liabilities (ie, bank reserves + reserves held in the government account, from BBG):
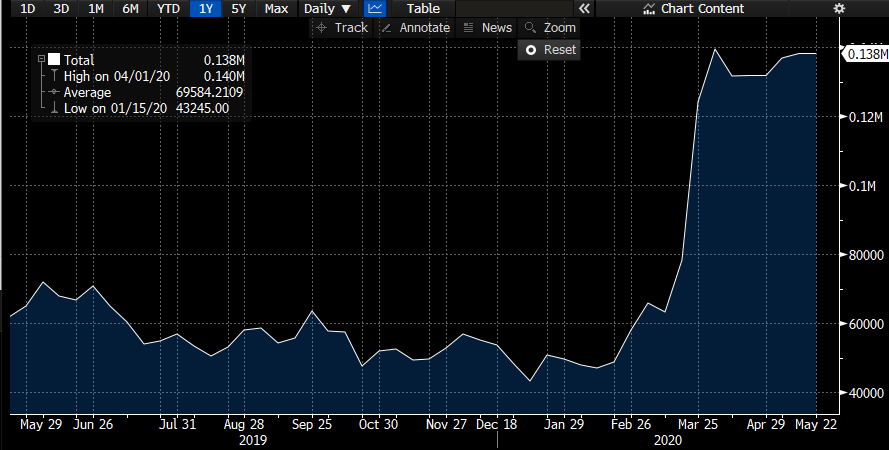
After March31st, the fun began. On the 15th of April, the AOFM came with a record AUD 13bio 5y Syndication. From the 31st of March to the 15th of April the RBA’s total reserves actually shrunk. Yes they were buying in the QE program, but the only way reserves get into the banking system is if the RBA take other assets out and put reserves in. They’d already done all they were going to do by the 1st week of April - doubtless in response to the global buyers strike on all financial assets in march. Whilst RBA purchases shrank by the day, this month has seen a total of 32.5bio issuance, and 6.5bio purchases. Net net, there’s been 61.5bio of selling from the AOFM against 51.5bio of purchases from the RBA since the 20th of March - but in the middle of that, market makers have had some heavy lifting to do.
Contrast that to the Kiwis - who have maintained impeccable coordination. On the 17th and 23rd of march the government announced the two first planks of its emergency spending plans - and on the 23rd the RBNZ announced asset purchases. Instead of rushing to the bond market the treasury went first to bills, increasing the outstanding to 3.7bio by the end of March from 2.5bio at the end of Feb. On the bonds side, only 450mio was put out. The RBNZ bought around 1bio. April saw the bill outstanding ramped up to 7billion, and 6.35bio of bonds, including a 3.5bio 10y syndication. - so around 9.5bio. The RBNZ took down 8.4bio, so a net 1.1bio supply which is about what the market had been expecting monthly from the previous funding strategy announced by the DMO. A remarkably coordinated balancing act.
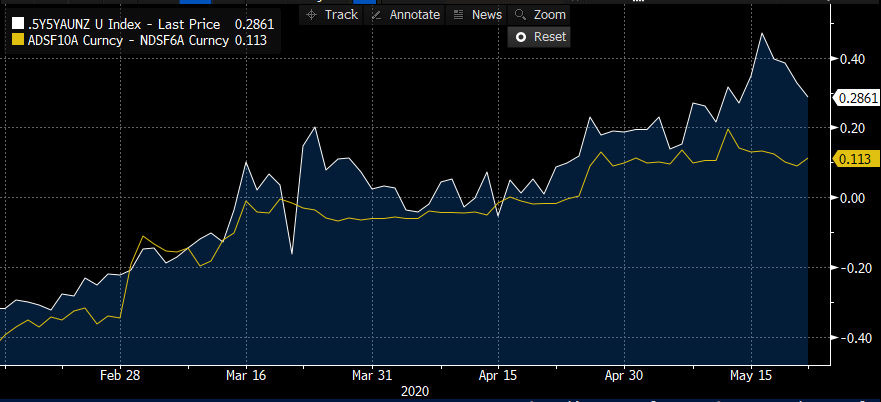
The markets responded with alacrity. Initially, the RBA’s purchases managed to return the 5y5y spread between AUD and NZD IRS to 0, but after the 15th of April it started higher and hasn’t reversed meaningfully until the last 48 hours. Of that 45bp move, 15bp is attributable to expectations of negative rates from the RBNZ in 2021, so on the same chart I’ve shown the 10th RBA meeting minus the 6th RBNZ meeting as the yellow line (RBNZ meetings are 6 weeks apart, vs RBA every month):
The lack of coordination between fiscal and monetary policy in australia, whilst the RBA have bought a similar portion of the governments issuance, has meant a wide and volatile risk premium in the Australian curve. So where from here? Fair value for that 5y5y spread vs the terminal OIS meeting spread was in a -5 to 20bp range:
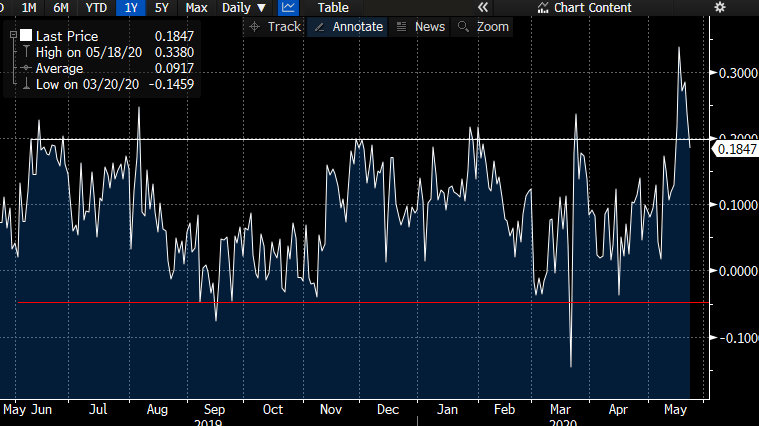
But that seems to have been broken. A 25bp wide range seems normal, 2017/18 saw the spread move between -30 and -5. With a new high at 35, a 10-35 range seems a reasonable assumption for the immediate future, and might just present some interesting trading opportunities!
There are of course more extreme example of uncoordinated policy, where the left hand knoweth not what the right hand doeth. In the Eurozone, it’s by design - although that may be changing. That’s an extreme example of a policy regime based on “hitting the crash barriers” rather than active coordination to manage the path of financial flows and prices - as NZ has done so effectively in this crisis. The Australian case is mild by comparison, which makes it an interesting one to watch for macro traders. To discuss in more detail, please do reach out in a private medium. Otherwise as always, enjoy a restful and life affirming weekend.
NB: This post is not investment advice and is not a trade recommendation. The views expressed here are my own and do not reflect those of my employer.