

The CNY is manipulated!
The CNY is manipulated!
By the US financial system's portfolio preferences?
TLDR:
Foreign holdings of USTs explain… the CNY exchange rate
Total foreign holdings better explain it than Chinese holdings
History tells us that foreign holdings follow from US bank and investor choices
US portfolio preferences could then determine CNY
If so, they’re pointing to a big CNY appreciation in the medium term
I’m indebted to Altaz Dagha, Phil McNicholas and Shyam Devani who talked this through with me and whose ideas I’ve… recycled
Whilst putting together another note on the long end (where i notice most banks have a headline grabbing recommendation to buy or sell this week!) I discovered a relationship that surprised me. I’d been looking at the 5s30s treasury spread. As I wrote last week, my thinking is that the relative price of financial assets is determined by how flow interacts with balance sheets. Different investors have different economic reasons for buying treasuries, and they often have little to do with the outright yield level. US domestic investors have the choice of various $ financial assets, but there are two big investors who don’t.
The first is the Federal reserve. Their superpower of converting financial assets into bank reserves is limited by precedent mainly the UST market, simply because to buy anything else is to get involved with credit allocation in the economy. Central banks used to do that happily, but it fell out of favour in the 80s and is only now making a bit of a comeback in the dollar world. The other is the foreign sector. The portfolio preferences of foreign investors are determined by the FX hedging costs and relative attractiveness of domestic assets. Foreign central banks holdings are determined by the extent to which they manage their exchange rate or intervene to sterilise foreign capital flows. They must buy $, and therefore treasuries, in order to prevent exchange rate appreciation and vice versa for depreciation.
I initially thought that the 5’s30’s spread might move with the holdings of these two big price insensitive holders. If their holdings decreased, that would mean price sensitive domestic investors would be absorbing the flow, pushing up the spread. That was not a good thought. In fact, when foreign holdings of UST’s reduce as a % of the total, the spread falls. From Bloomberg, here’s 5s30s (White), Fed SOMA holdings as a portion of total debt (Yellow, inverted) and foreign holdings of USTs as a portion of total debt (Green) :
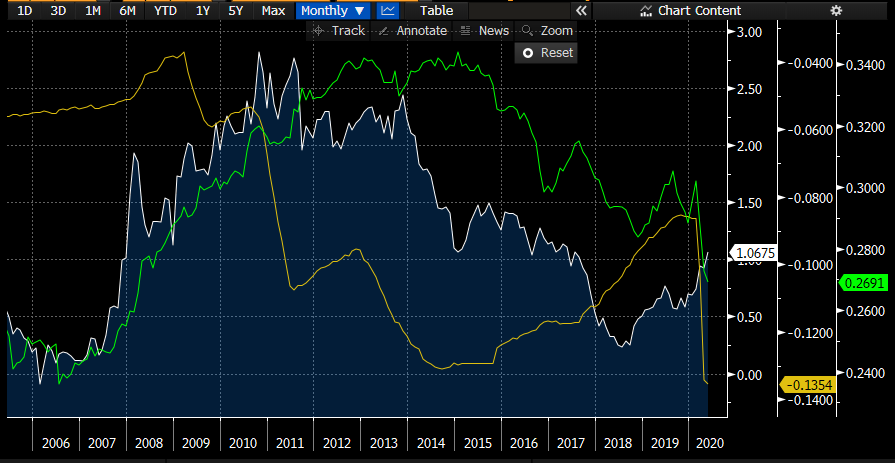
It would have been naive of me to expect some kind of neat relationship and indeed i didn’t. What surprised me though is that, as often happens, i’d thought about it completely the wrong way round. Foreign holders of treasuries were the ones doing the absorbing. When 5s30s increases, their share increases (2006-2011), and vice versa (2011-2018). The Fed’s holdings follow the direction I’d thought they would. When increasing (2012-2014), 5s30s flattens - and when decreasing (2018-19) it steepens. There’s a big exception in 2010/11 of course - but I’ll try to cover that in a subsequent post. For now, suffice to say that I was quite surprised at the way foreign holdings moved with the curve. Luckily, I have smart colleagues, well, at least one smart colleague, who remarked that the green line reminded him of something:
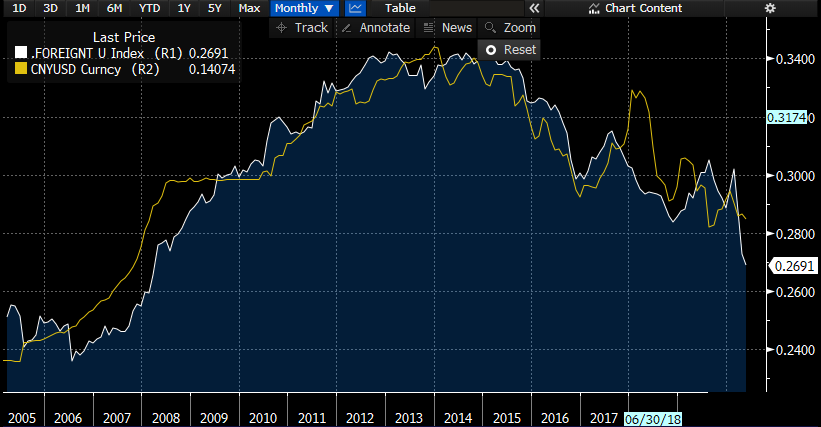
That something would be CNY (yellow). The relationship has held with amazing consistency since the CNY began to appreciate in 2005. The direction of the relationship makes some intuitive sense given what is involved in managing an exchange rate. If the CNY is appreciating and the Chinese authorities want to stop it, they must accumulate reserves (treasuries). So, we should see an even closer fit adding in just Chinese holdings as a % of the total (green line), right?
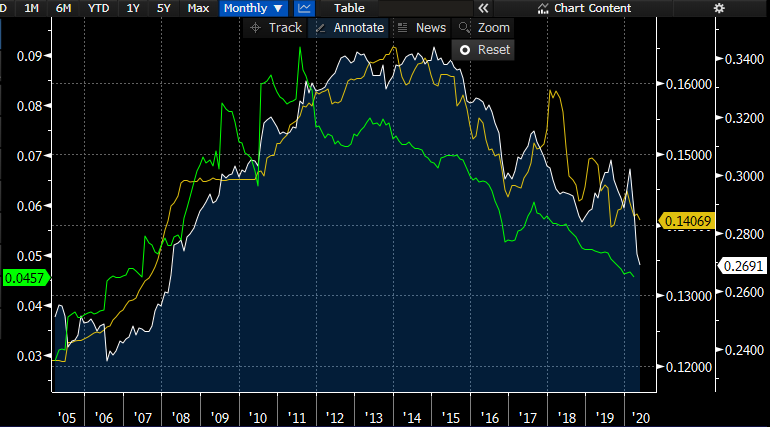
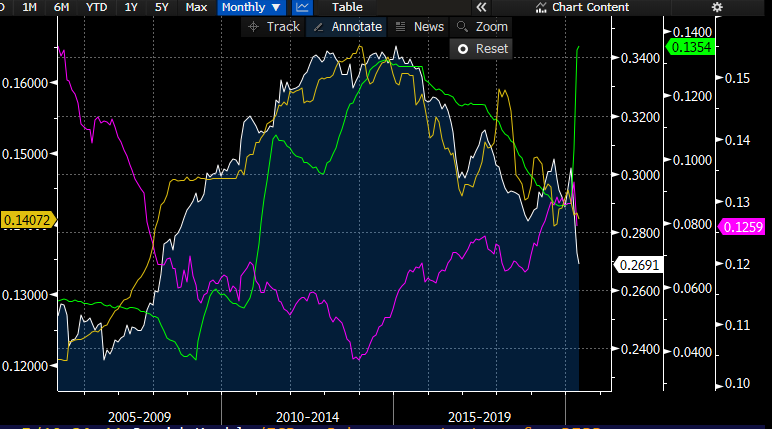
Wrong again BCL. When the white and green lines move in opposite directions (2011, 2018) , the CNY follows the white. The difference is even starker when you normalise each to the start of the CNY appreciation in 2005:
Not only are the total holdings more related dynamically, the proportional moves are roughly in line also. In other words, a % increase in the proportion of US treasuries held by foreigners coincides with a roughly equal percentage increase in CNY.*
This obviously surprised me which is why I’m writing to you about it, but should it have? One of the more famous economics memes in markets is the Mundell-Flemming impossible trinity, or trillema. One cannot have independent monetary policy, a fixed exchange rate and free capital flows at the same time. China, to the puzzlement of many economists, seems to have found a way round this. They manage all three sides of the trillemma - with substantial capital flows, a manged exchange rate and domestic credit conditions over which the PBOC has a high level of control. The secret ingredient in all 3 cases is a massive state capacity - where the normal linkages that exist in a capitalist economy between financial flows and the allocation of real resources are highly managed. That takes care of the real side of the economy, but FX is a financial phenomenon. This relationship gives an important clue to how they relate. Chinese policy can take care of sterilising a bilateral imbalance with the US, the constraints come from USD flows in a dollarised world.
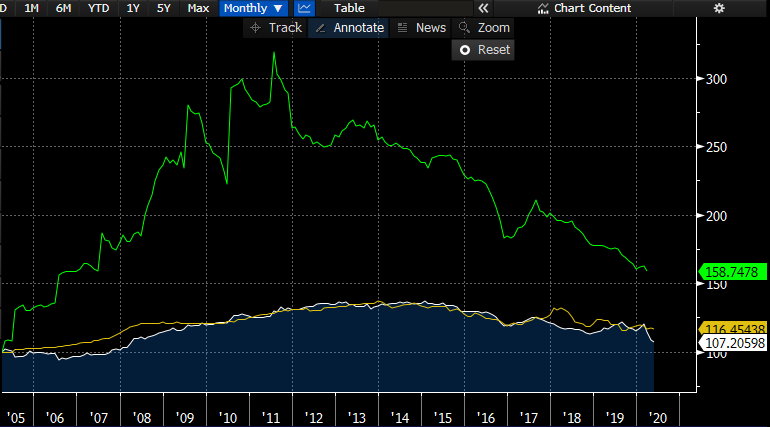
Take the flows around the GFC from that perspective. Here, I’ve added the two other parts of the system that can be teased out from the data on who holds treasuries - the Fed (green) and US banks (Pink). Again, it’s proportions of UST’s they hold vs the total. CNY is on the left hand axis. Apologies for the busy chart:
From ‘05 to ‘08, US banks rid themselves of 3% of the outstanding treasury stock (15% to 12%. That 3% was taken down by the foreign sector, whose share rose from 24 to 27%. During that time, US banks were of course adding a frenzy of mortgage assets - growing their balance sheets enormously. That decision, and the divestment of Treasuries that came with it, forced the rest of the world to accumulate. With the whole world facing a glut of $ assets, China must have had no way to stem the pressure on its exchange rate but through a managed appreciation. Had the rest of the world been short of $ assets, China could have simply passed them on. My earlier chart tells the story, to refresh:
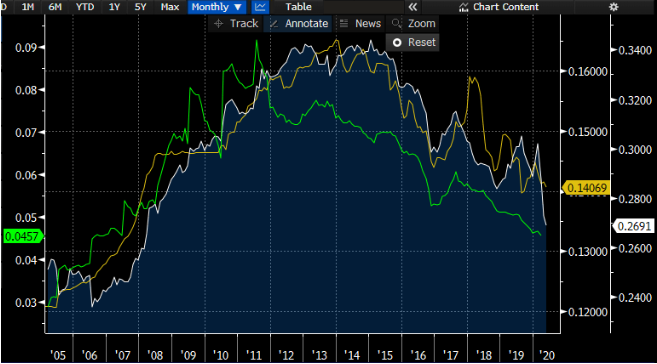
In 06 and 07, Chinese treasury holdings (green) spiked sharply. In 09 and 10 it was even worse - with the Fed no longer adding to their share of the US debt burden - China was forced to take down 1% of the treasury stock in a single month in ‘09 to keep the CNY competitive. ‘09 to ‘10 they sold it back, but the resultant pressure caused a bigger spike - even though they took down another 2% of the US treasury stock to stem the tide. Over time it seems they’ve no choice but to allow CNY to appreciate or depreciate with changes in the share of the US debt stock held by foreigners.
So what’s true of the current situation if this theory is accurate? To the end of April, the stock of Treasury debt increased $1.5trio. The Fed took down almost the whole amount, 1.3trio - so the pass through to foreigners will depend on what the private sector did. Banks stepped up, adding 130bio. Price action however indicates that the foreign sector probably had to do a lot of heavy lifting for the non bank private sector. 5’s30’s steepening, which in the past has been associated with a transfer of the UST debt burden from the US bank and private sector to the foreign sector (1st chart), indicates this has been happening this time round. Roughly 45% of Treasuries are held by the US domestic non bank sector. A small portfolio adjustment away from debt would mean a substantial increase for the rest of the world. If that’s true, then the current pressure on spot CNY makes sense - whoever is buying UST must be selling something else. But in the medium term, if the relationship shown here holds, a strong appreciation could be on the cards.
NB: This post is not investment advice and is not a trade recommendation. The views expressed here are my own and do not reflect those of my employer.
* I’m aware that this is a bit of a chartcrime and is presented as circumstantial evidence only.
The charts do look convincing, but I find it somewhat dubious that the relationship is better explained by total foreign holdings. One explanation I could think of is some foreign holdings could be difficult to attribute back to China, is that true? Would be interesting to see the correlation between MoM change of foreign holdings vs MoM change in CNY.
Also just generally, the 5s30s steepen because 5s are used for reserve accumulation?
Thanks.